2025 NFL Kickoff: Week 13 ATS, ML & Over/Under Forecast for Thursday Game
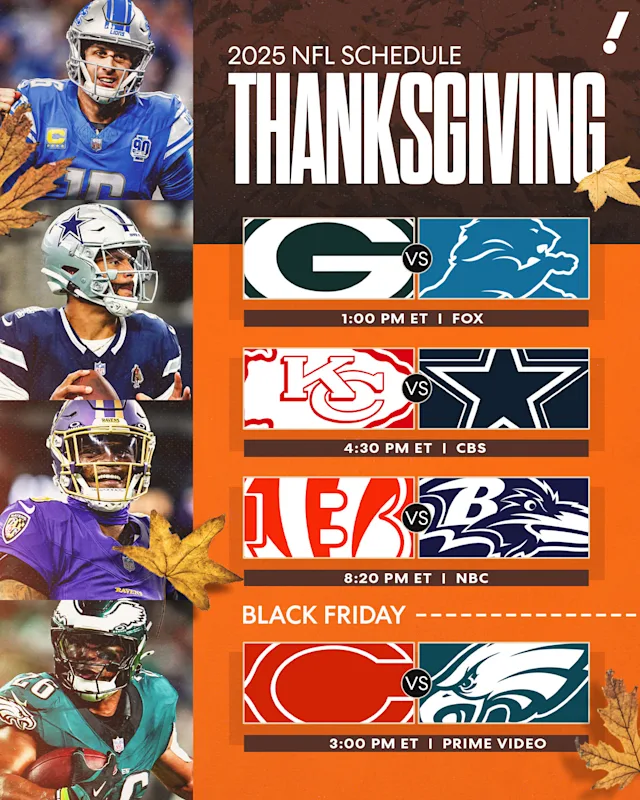
Thanksgiving • Week 13
Greenbay Packers @ Detroit Lions
Forecast: GB 21 – DET 24
Projected margin (fair line): DET -0.5
Against the Spread
Market line: DET -2.5
Pick: DET -2.5 (covers)
Edge: 2
pts fair vs market • Cover margin vs line: 2
Estimated cover probability: 56%
Moneyline
Winner: Detroit Lions
Estimated win probability: =71%
Total (O/U)
Market total: 48.5
Projected total: 45
Tilt: Under 48.5 (small lean)
Why this leans Detroit Lions & Under
Projected line -0.5 vs market -2.5 → -2 pts of value; forecast 24–21 covers by 0.5.
Model implies 56% ATS cover for DET at -2.5
Projected total (45) below market (48.5) → Under lean; My data model signals edge on the Lions due to the Public sides(Detroit -2.5) who are favorites are 32-15 ATS on Thanksgiving Day games in the NFL
Notes: ATS% and ML% derived from model forecast with historical residual volatility. Treat total as lower confidence than
Thanksgiving • Week 13
Kansas City Chiefs @ Dallas Cowboys
Forecast: KC 27 – DAL 23
Projected margin (fair line): KC -3
Against the Spread
Market line: KC -3
Pick: KC -3 (covers)
Edge: 0
pts fair vs market • Cover margin vs line: 0
Estimated cover probability: 50%
Moneyline
Winner: Kansas City
Estimated win probability: =65%
Total (O/U)
Market total: 52
Projected total: 50
Tilt: Under 52 (small lean)
Why this leans Kansas City Chiefs & Under
Projected line -3 vs market -3 → 0 pts of value; forecast 27–23 covers by 0.5.
Model implies 50% ATS cover for KC at -3
Projected total (50) below market (52) → Under lean; My data model signals edge on the Chiefs due to Road favorites are 25-1 SU and 20-6 ATS on Thanksgiving since 2004
Notes: ATS% and ML% derived from model forecast with historical residual volatility. Treat total as lower confidence than
Thanksgiving • Week 13
Cincinnati Bengals @ Baltimore Ravens
Forecast: CIN 24 – BAL 27
Projected margin (fair line): CIN +7
Against the Spread
Market line: CIN +7
Pick: CIN +7 (covers)
Edge: 0
pts fair vs market • Cover margin vs line: 0
Estimated cover probability: 50%
Moneyline
Winner: Baltimore Ravens
Estimated win probability: =65%
Total (O/U)
Market total: 52
Projected total: 51
Tilt: Under 52 (small lean)
Why this leans Cincinnati & Under
Projected line -8.5 vs market -7 → -1.5 pts of value; forecast 27–24 covers by 3.
Model implies 50% ATS cover for CIN at +7
Projected total (50) below market (52) → Under lean; My data model signals edge on the Bengals due When Burrow closes as an underdog of 3 points or more, he is 17-3 ATS, covering the spread by 5.6 PPG.
Notes: ATS% and ML% derived from model forecast with historical residual volatility. Treat total as lower confidence than
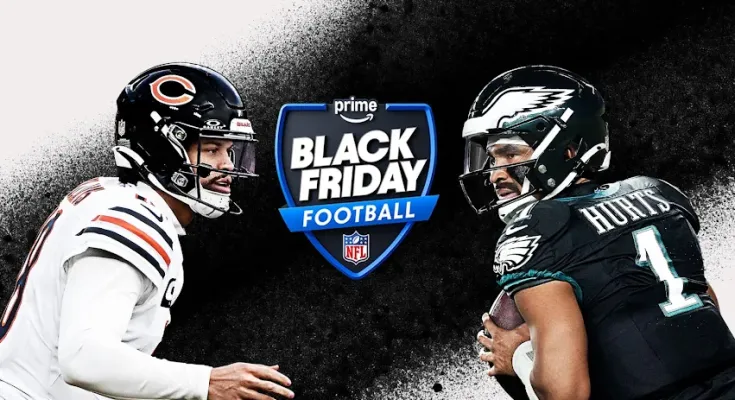
Black Friday • Week 13
Chicago Bears @ Philadelphia Eagles
Forecast: CHI 20 – PHI 29
Projected margin (fair line): PHI -7
Against the Spread
Market line: PHI -7
Pick: PHI -7 (covers)
Edge: 0
pts fair vs market • Cover margin vs line: 0
Estimated cover probability: 50%
Moneyline
Winner: Philadelphia Eagles
Estimated win probability: =65%
Total (O/U)
Market total: 44
Projected total: 49
Tilt: Over 44 (small lean)
Why this leans Philadelphia Eagles & Over
Projected line -3.5 vs market -7 → -3.5 pts of value; forecast 29–20 covers by 2.
Model implies 50% ATS cover for PHI at -7
Projected total (49) above market (44) → Over lean; My data model signals edge on the Eagles in the ultimate bounce-back spot: Over the last five years, teams shut out in the second half as betting favorites in that game are 38-29 SU and 40-27-1 ATS (60%) in their next game.
Notes: ATS% and ML% derived from model forecast with historical residual volatility. Treat total as lower confidence than